Arduino-based Weather Station
Also known as: building your own weather station instead of buying a professional one cheaper, offering more functionality and less frustration.
The screen of the lovely weather station with a backlit sun and clouds, purchased a few weeks ago from Aliexpress for 15$, reads (as ever so often): “Indoor temperature: 20.6 C, indoor humidity: 56%. Outdoor temperature: -.– C, outdoor humidty: –%”. This journey begins on a Tuesday morning as I am looking at our certainly-cute-but-not-too-reliable weather station. The base station lost connection to the outdoor unit - again. “Why not build your own then?”, I said to myself, and so I did.
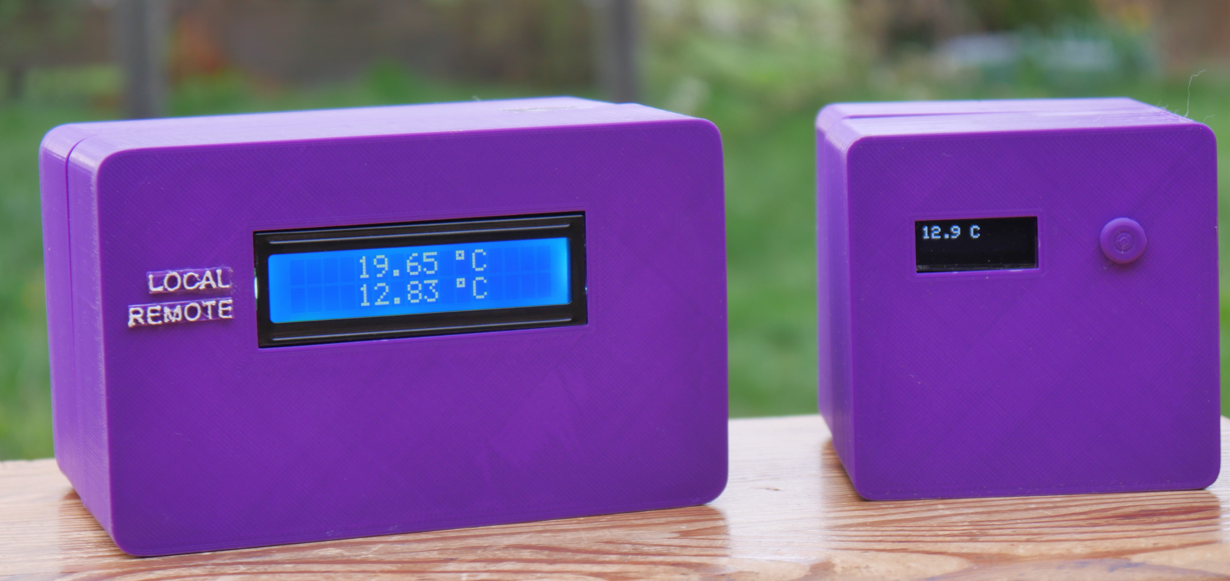
I wanted to build a weather station similar to those available commercially. The system consists of a base station that can be put on a shelf or table indoor and a remote unit that can be placed outdoor, though it should not come in direct contact with water. Both units measure temperature, pressure and humidity. The remote unit transmits the data to the base station that displays both indoor and outdoor measurements. The remote unit features a display too, which is off by default and displays current measurement values for a few seconds when the button on the unit is pressed. The display of the base station is always on.
HARDWARE
The hardware is required to:
Base station:
- measure temperature, pressure and humidity
- display both measured and received values on an LCD
Remote unit:
- measure temperature, pressure and humidity
- send measured values to the base station
- display measured values on an LCD if a button is pressed
Temperature, pressure, and humidity are measured by a widely available combined AHT20 + BMP280 sensor. The former chip can measure temperature and humidity, while the latter can measure temperature and pressure. The two chips are built on a single board and have a common I2C breakout (more about that later). Such devices are available for around 3$ online.
The measured values than can be displayed on a screen, e.g. a 128 X 32 LCD, which I used. These are available for around 6$ online.
The wireless communication between the two units is realized with the help of two nRF24L01 radio modules. These modules allow for wireless communication of 5-50 m, depending on the circumstances (walls are bad for range, obviously). One module goes for about 3$ online.
Last but not least: the “brain” of the weather station, which consists of two Arduinos.
The Arduino platform is an 8-bit, user-friendly environment for hobby, ultra-fast prototyping and experimenting. There is a wide variety of boards available, ranging from the Arduino Nano with a flash memory of 32 kB and a clock speed of 16 MHz all the way up to the 32-bit, STM32-based Arduino G1 Wi-Fi with 2 MB of flash memory and a clock speed of 480 MHz.
Although ESP32-based or STM32-based boards would be a great option too, I went with the Arduinos as neither Wi-Fi, nor a significant computing capacity is required for this project.
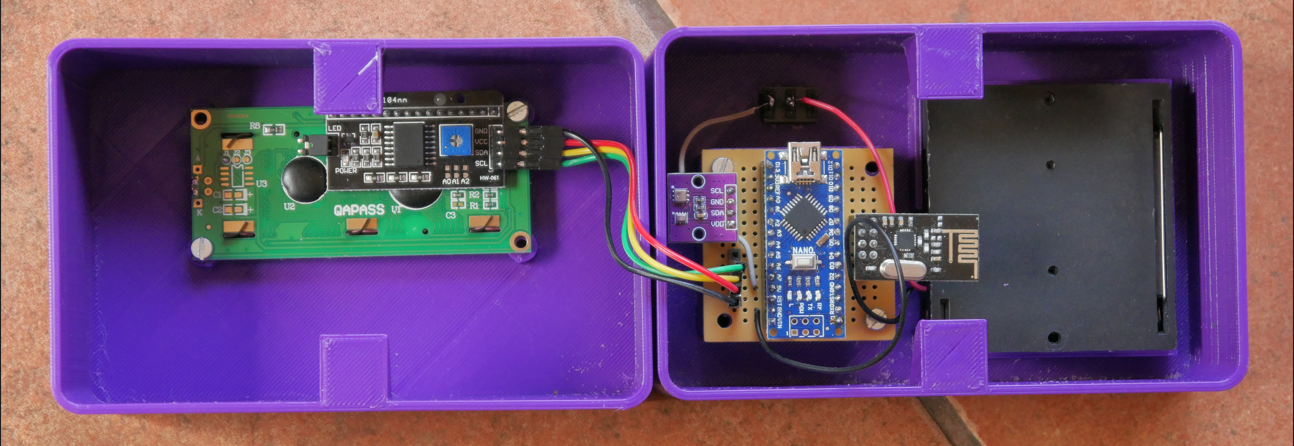
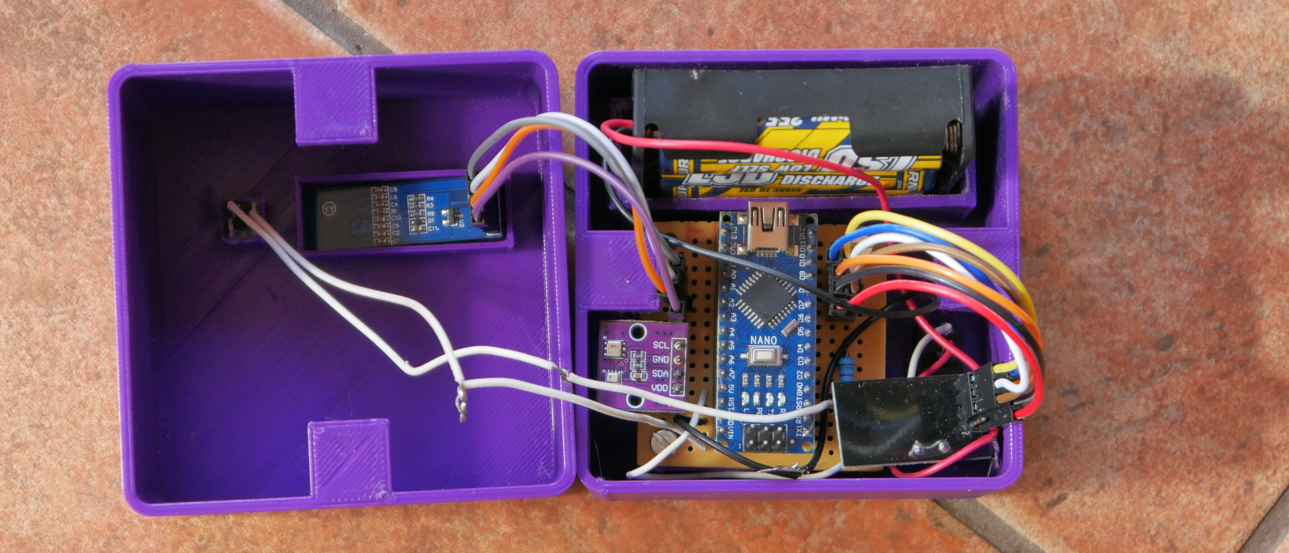
The modules are connected to the Arduino using a prototyping PCB. The devices are packaged in a 3D printed housing (designed and printed by the author too).
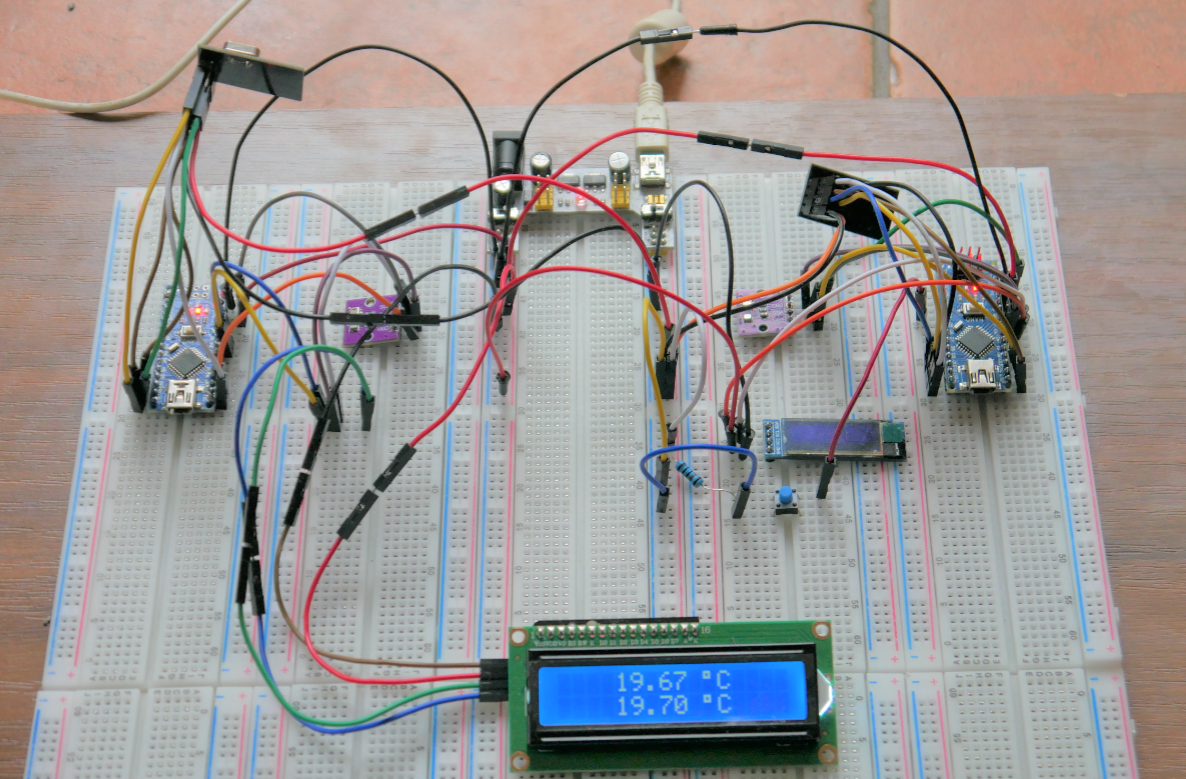
First, the setup was built on breadboards to test it.
After making sure everything worked as intended, the parts were soldered together and placed inside their custom-made cases.
SOFTWARE
The software is required to do the following tasks:
- make a measurement with the sensors and store the returned values
- display measured values
- transmit/receive measured values
- monitor the state of a push button
For the software of the Arduinos, C++ was a natural choice. To make the measurements, the Sparkfun AHT20, and the Adafruit BMP280 libraries were used for the two sensors. To drive the display, the libraries LiquidCrystalI2C and Adafruit SSD1306 were used. To control the transceiver, the NRFLite library was used. You can find the complete code for both the base station and the remote unit in my GitHub repository: https://github.com/sdomoszlai13/weather-station.
Choosing a Communication Protocol
When using peripheral devices with microcomputers like, you can choose from a number of communication protocols to use: SPI, I2C, UART etc. Each of these have their advantages and disadvantages, which won’t be discussed here in detail. As I2C is a bit slower than than the others, but only requires 2 wires (besides VCC and GND), this protocol is used with the AHT20 and the BMP280 sensors, as well as with the LCD. However, as the nRF24L01 doesn’t have I2C available, communications happen with the help of SPI. The devices are wired up accordingly.
Base Station Code Highlights
When writing the code for the base station, the first step is to do the setup required to get the sensors, the transceiver and the LCD up and running. The details are rather uninteresting and won’t be discussed here in-depth. One thing to note is that depending on the manufacturer of your LCD, the default I2C address of your LCD can be any integer between 0x20 and 0x27. This address can be changed by soldering jumpers on the back of the LCD. This way, up to eight such LCDs can be used with one Arduino. In any case, make sure the display address matches the address in your software setup.
To keep communication between the two units simple, I created a struct that contains three variables of the type float: temp, pres, and hum, that store the last measured values of the temperature, pressure, and humidity, respectively.
struct RadioPacket  // Packet to be received
{
    float temp;
    float pres;
    float hum;
};
The outdoor unit regulary sends a single instance of this struct (RadioPacket) to the base station, which receives it as you can see below.
RadioPacket receiveData(){

    RadioPacket _radioData = {-99.0, -99.0, -99.0};

    if (_radio.hasData())
    {
        _radio.readData(&_radioData);
    }

    return _radioData;
}
The default values are -99.0 so that if there’s no reception, it can easily be noticed on the screen of the base station.
A major challenge in implementing the base station code was figuring out the best way to write the function printing data on the display. The first thing to note here is that the LCD used isn’t big enough to display a pair (indoor and outdoor) of temperatures, pressures, and humidities at the same time. For this reason, the LCD works the following way: first, it shows the indoor and outdoor temperatures in separate lines, next it shows the indoor and outdoor pressures, and last it shows the indoor and outdoor humidities.
However, these values have different lengths, different precisions and different units. This problem was solved using an enum containing the strings “temp”, “pres”, and “hum”. The function that prints the values on the LCD determines if a temperature, a pressure, or a humidity should be printed and prints units accordingly.
void printData(float indoor_val, float outdoor_val, TypeOfVal type_of_val){

    if (type_of_val == temp)
    {
        lcd.setCursor(4,0);
        lcd.print(indoor_val);
        lcd.setCursor(10,0);
        lcd.print((char)223);
        lcd.print("C");
        lcd.setCursor(4,1);
        lcd.print(outdoor_val);
        lcd.setCursor(10,1);
        lcd.print((char)223);
        lcd.print("C");
    }

    else if (type_of_val == pres)
    {
        lcd.setCursor(3,0);
        lcd.print(indoor_val);
        lcd.setCursor(9,0);
        lcd.print(" hPa");
        lcd.setCursor(3,1);
        lcd.print(outdoor_val);
        lcd.setCursor(9,1);
        lcd.print(" hPa");
    }

    else if (type_of_val == hum)
    {
        lcd.setCursor(5,0);
        lcd.print(indoor_val);
        lcd.setCursor(10,0);
        lcd.print("%");
        lcd.setCursor(5,1);
        lcd.print(outdoor_val);
        lcd.setCursor(10,1);
        lcd.print("%");
    }

    else
    {
        lcd.setCursor(0,1);
        lcd.print("Unknown data type!");
    }
}
Remote Unit Code Highlights
The remote unit’s display library is more sophisticated and hence, no tricks were required to print the values as with the base station. However, as the screen of the remote unit won’t be of interest about 99.9% of the time, I decided it should be turned off by default. Only a button press should activate the LCD. This feature is implemented with a press button that’s connected in series with a 47 kΩ resistor between $V_{CC}$ and $GND$. Such push buttons usually need to be debounced so a single button press doesn’t produce multiple rising and falling edges. However, as I determined using an oscilloscope, this setup works reliably without sotware or hardware debouncing, at least when using the fallling edge as the ISR trigger (see section Bonus Material: Investigating Push Button Bouncing at the end of this post for details).
The software challenge with the remote unit was the detection of the button press. The Arduino loop() runs forever, and in this case, makes measurements, and sends data. The state of the button could also be monitored in the loop() function to see if the button was pressed. There’s just one problem: what if the button is pressed when the processor is busy sending data or doing measurements? Luckily, there’s a concept in microcontroller technology just for this problem: the interrupt service routine (ISR).
An ISR can be called by an event, e.g., a change in a variable or a change in the logic level of an input pin. So, I connected the push button to the digital pin D2 of the Arduino and monitored it’s state in an ISR. Too easy, right? Right: as always, the devil is in the details. An ISR interrupts every process that the processor is working on and can cause serious trouble if it runs for a significant amount of time. For this reason, ISRs should be kept as short as possible. Also, function calls can only be made without passing arguments and no return values are allowed. Wanna use millis() or micros() to measure time intervals or print something on the serial monitor? Sorry, not possible inside an ISR! I bet now you’d wanna finish the ISR as soon as possible even if it weren’t be best practice…
The best way to monitor a push button with an ISR goes for the reasons mentioned above as follows:
- let the ISR be called when a rising/falling edge is detected at the push button
- let the ISR assign a new value to a variable used to monitor the push button state
- compare the variable to a reference value in the
loop()function.
This way, the ISR is kept as short as possible.
volatile byte button_pressed = LOW; // Global variable for the ISR to monitor button
const byte button_compare = HIGH;   // Byte to compare button_pressed to
const byte interrupt_pin = 2;       // Using digital pin 2 as interrupt pin

// Setup interrupt service routine
pinMode(interrupt_pin, INPUT_PULLUP);
attachInterrupt(digitalPinToInterrupt(interrupt_pin), buttonPressed, FALLING);

// Print values on display if button is pressed
if (button_pressed == button_compare)
{
    printData(temp, pres, hum);
    button_pressed = LOW;
    Serial.println("Button pressed, display activated");
}

// ISR
void buttonPressed(){

    button_pressed = HIGH;
}
CASE
The case is a custom-made, 3D printed part. I designed it myself to fit my needs. There’s nothing special here; it’s a case that allows a PCB and an LCD to be screwed in, a button to be glued in and a little pocket for the battery holder. Both cases are held together by magnets put into the “pockets” of the individual parts. Some pictures of the nice (?) purple-colored cases are shown below.
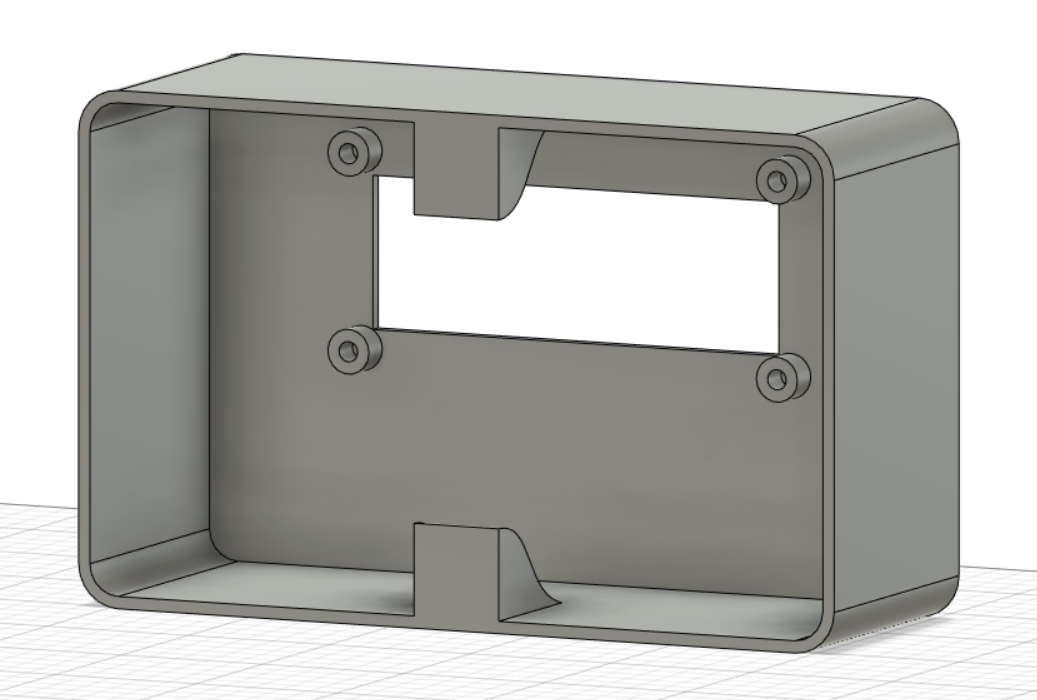
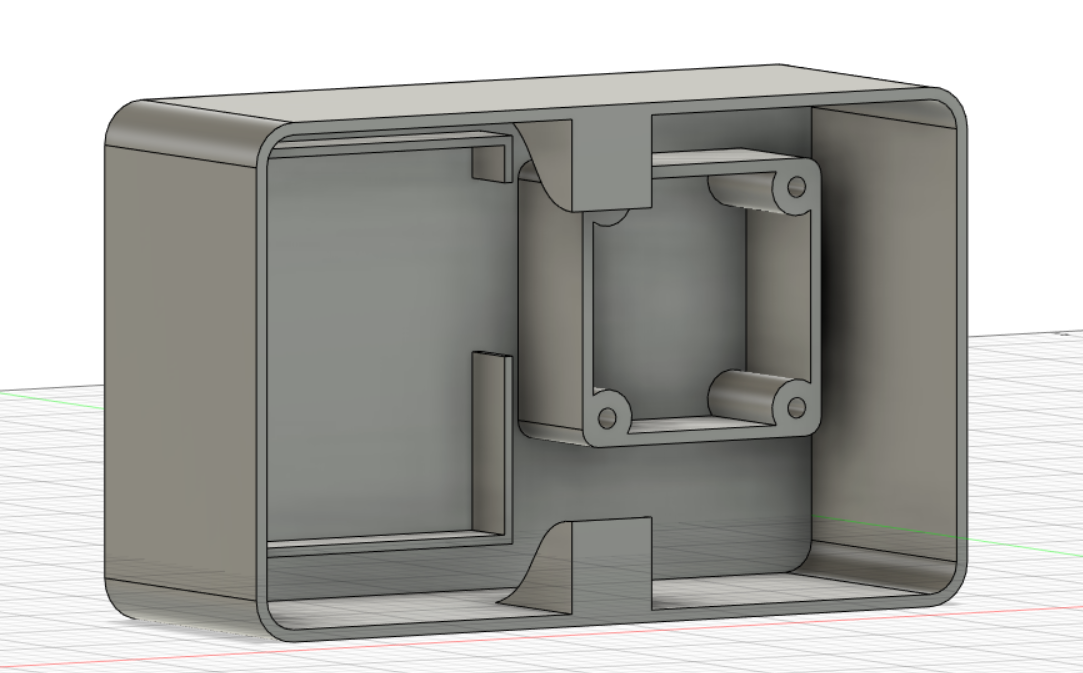
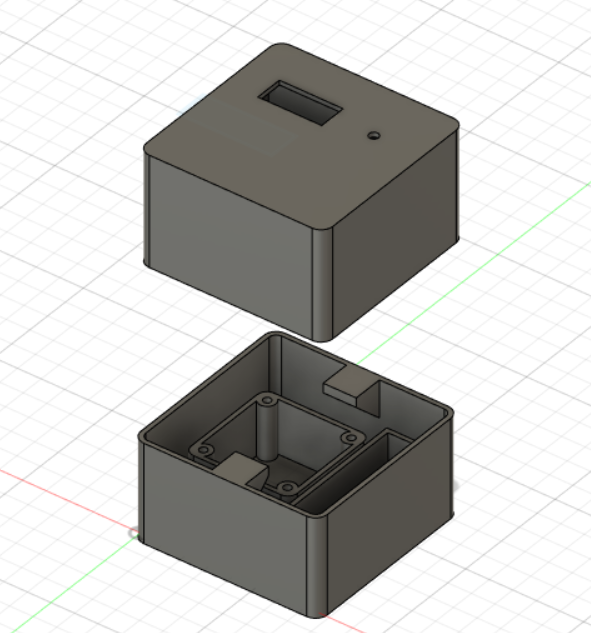
The case was designed in Fusion360 and printed with my Creality Ender 3 from PLA. M3 screws fit can be screwed into the holes.
Summary
A home-made weather station is a nice project to experiment with different sensors and transceivers. I’d say the software part is quite straight forward. The hardware part requires a bit more planning. A 3D printer certainly helps with the project.
You can find the complete code for both the base station and the remote unit in my GitHub repository: https://github.com/sdomoszlai13/weather-station.
Bonus Material: Investigating Push Button Bouncing
Push buttons have a purely mechanical operating principle. When the plastic rod is pressed, an electrical contant is made between the pins of the button. Although it can’t be felt by the user, the pushed vibrates on the contact plate before coming to a rest. This lasts fractions of a second but can cause serious trouble in digital circuits, as a single button press may seem to be multiple successive button presses to the electrical circuit. To prevent this behavior, mechanical precautions (e.g., a capacitor) can be taken or software tweaks (e.g., a delay after every buttton push) be made. For more details, take a look at [https://docs.arduino.cc/built-in-examples/digital/Debounce] (https://docs.arduino.cc/built-in-examples/digital/Debounce).
Another aspect to consider is whether to use falling edges, rising edges, or both as triggers. In this case, only the fact that the button was pushed is of interest. Therefore, triggering on only one of them is satisfactory. Now, which one is more reliable to use, you ask?
One terminal of the push button is connected to $V_{CC}$ (in this case, 5 V) through a 100 kΩ resistor, and the other one to $GND$. Probing at the former terminal, we measure 5 V as long as the button is not pushed and 0 V when it is pushed.
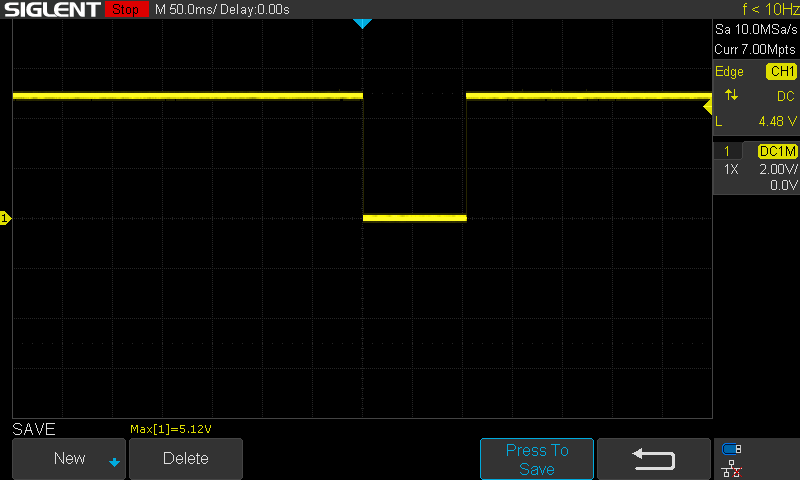
Both the rising and the falling edges look perfect, one is tempted to look no further and use either one to trigger. However, as the reader is certainly smarter than most others, we do look further.
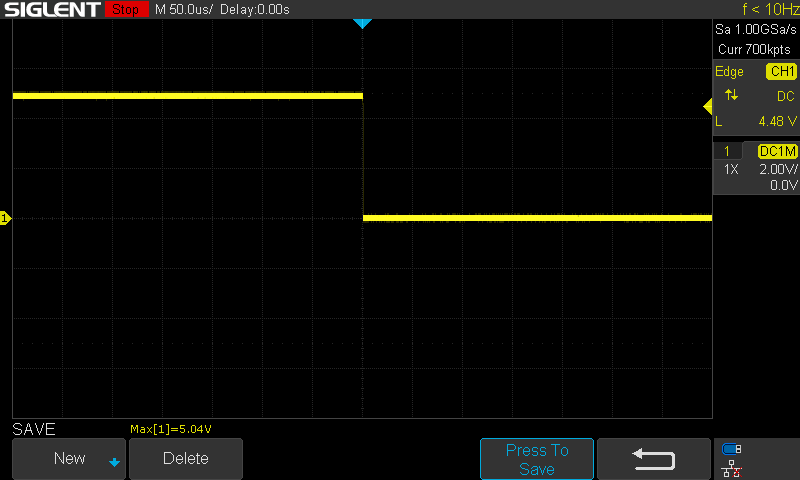
The above image has a time scale resolution 1,000 times finer than the above picture. The falling edge looks perfect, as before.
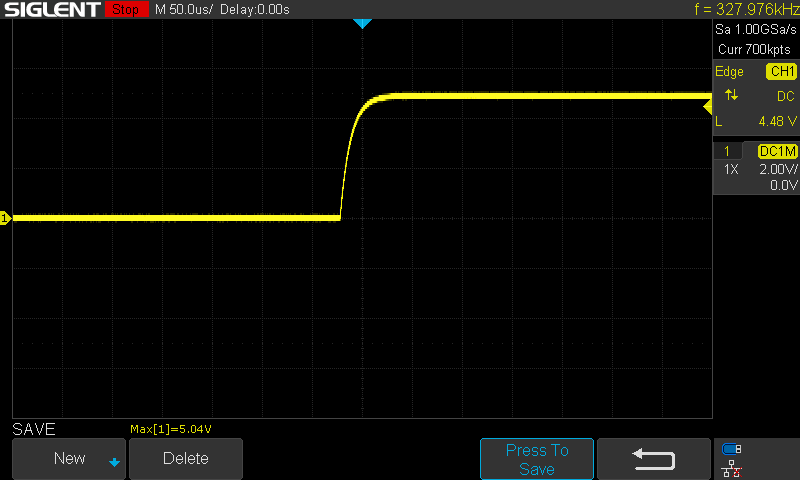
What happened here? Well, the rising edge lasts about 10 µs, which is acceptable as the Arduino is probably never fast enough for this delay to cause trouble. Nevertheless, it’s worth noting that there’s a significant difference in the rise time and the fall time. Let’s zoom in even further to see if our perfect falling edge is perfect indeed.
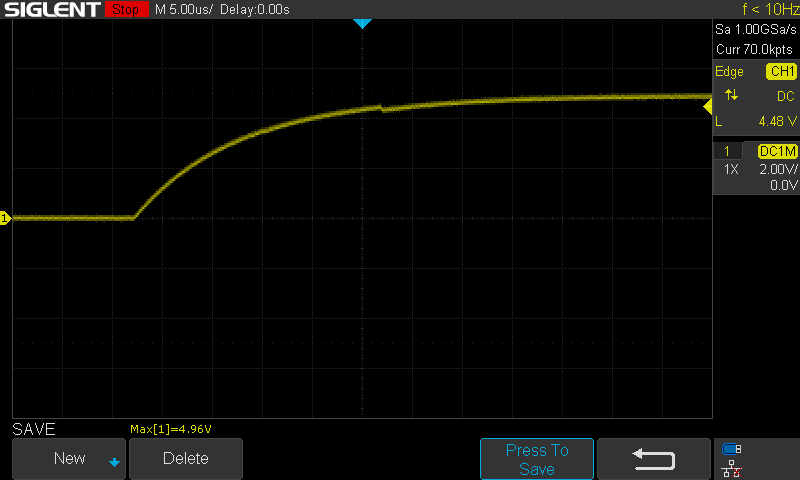
Here, we can see even better how the rising edge is in fact an exponential function, probably caused by some capacitance in the circuit (10 times finer time scale than above).
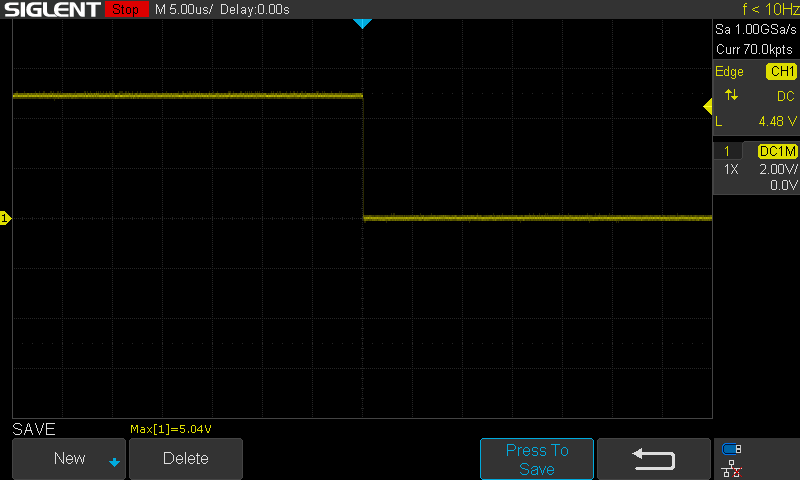
At this time scale, we’re beginning to see the real nature of the falling edge too. Still, we are at a 1,000 finer time scale compared to the time scale where the rising edge began to look like an exponential curve. Using the falling edge as a trigger is therefore absolutely safe.
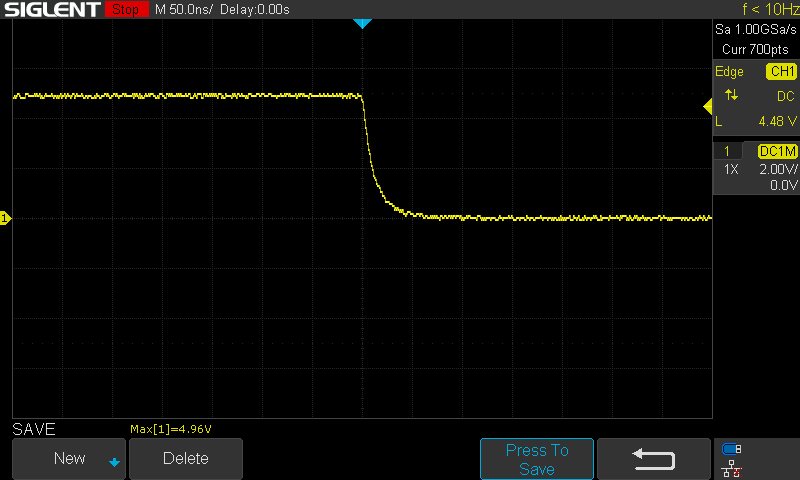
Finally, at 50 ns, the exponential voltage change is fully revealed at the falling edge too. In a low-freqency application like push buttons, this is perfectly fine and won’t cause any troubles. However, it’s interesting to note that modern CPUs are working with clock speeds with frequencies in the order of GHz, which means periods on the order of ns. This means that even instantaneous metal contact switches wouldn’t be fast enough to build modern CPUs. Wonders of technology…